• Skip to main content
  • Skip to primary sidebar
  • Skip to secondary sidebar
  • Skip to footer

Computer Notes

Library
    • Computer Fundamental
    • Computer Memory
    • DBMS Tutorial
    • Operating System
    • Computer Networking
    • C Programming
    • C++ Programming
    • Java Programming
    • C# Programming
    • SQL Tutorial
    • Management Tutorial
    • Computer Graphics
    • Compiler Design
    • Style Sheet
    • JavaScript Tutorial
    • Html Tutorial
    • Wordpress Tutorial
    • Python Tutorial
    • PHP Tutorial
    • JSP Tutorial
    • AngularJS Tutorial
    • Data Structures
    • E Commerce Tutorial
    • Visual Basic
    • Structs2 Tutorial
    • Digital Electronics
    • Internet Terms
    • Servlet Tutorial
    • Software Engineering
    • Interviews Questions
    • Basic Terms
    • Troubleshooting
Menu

Header Right

Home » Graphics » Computer Graphics

What is Rendering?

By Dinesh Thakur

Since large drawings cannot fit in their entirety on display screens, they can either be compressed to fit, thereby obscuring details and creating clutter, or only a portion of the total drawing can be displayed. The portion of a 2D or 3D object to be displayed is chosen through specification of a rectangular window that limits what part of the drawing can be seen.

A 2D window is usually defined by choosing a maximum and minimum value for its x- and y-coordinates, or by specifying the center of the window and giving its maximum relative height and width. Simple subtractions or comparisons suffice to determine whether a point is in view. For lines and polygons, a clipping operation is performed that discards those parts that fall outside of the window. Only those parts that remain inside the window are drawn or otherwise rendered to make them visible.
What is coordinate?

By Dinesh Thakur

Built into your computer is a mapping system, or grid, complete with the ability to pinpoint any location or coordinate in the application window. This grid is laid out in the common x,y format-x being the horizontal units of measure starting from the left side of the screen, and y being the units starting from the top of the screen. It’s easy to see that 0,0 would be the upper left corner of the screen. Now, if you’re only using your computer for word processing, then you have no real use for knowing exactly where your cursor is. But in the painting and drawing world, knowing these coordinates is very helpful-to say the least-and it’s essential in a lot of instances. Nearly all graphic and page layout applications give you a separate window which shows the coordinates of where your cursor is located at any given moment. By watching your coordinates you can move, create, shape, or select objects or portions thereof with great precision.

What is Compression?

By Dinesh Thakur

The processing of a set of data in order to reduce its size. Compression may be performed both to reduce the amount of storage space occupied (say, to fit the data onto a single CD) and to reduce the time it takes to transmit (say, over a slow telephone line). Compressed data must be decompressed by reversing the process before it can be read or modified.

When you compress computerized information, you make it smaller (taking up less space on the disk), meaning that less data is needed to represent exactly the same information. Using a compression utility, you can compress files stored on disk so that they take up less disk space and leave more space for other files. Some programs have the ability to compress data that’s being held in memory, allowing the computer to keep more data in memory and thus spend less time retrieving data from the disk. And some modems and communications software can compress the data they send back and forth to one another. Since there’s less data, it takes less time to transfer them.

Keep in mind that even when you are archiving files you never want to compress your original and only file. All it takes is to lose one bit, one electronic signal, from a compressed file and that file is destroyed. Bits get lost all the time. In an uncompressed file, it’s a minor problem, but in a compressed file, it can be a catastrophe of considerable dimension.

There are many known compression/ decompression ALGORITHMaSn,d the search for better ones has become commercially important since most new communications technologies (such as digital television) can only work with effective data compression.

All compression algorithms work by uncovering and eliminating redundancy in the data, and there is an important distinction between those that preserve all the information in the data (loss/ess methods) and those that sacrifice some information for greater compression (lossy methods). Lossy algorithms such as JPEG and MPEG are suitable only for final delivery of data to end users, as the information losses accumulate each time the material is recompressed and decompressed.

What is CODEC?

By Dinesh Thakur

CODEC is a shorthand way of saying “compressor/decompressor.” It refers to a variety of software products that determine how a movie file, such as QuickTime, should be condensed, or compressed, to save space on the hard disk and to make the movie run faster. You might choose a different CODEC for video images than you would for still photography images. The different choices strike a different balance between picture quality and the size of the file (how many megabytes it requires to store it on the hard disk).

What is CMYK?

By Dinesh Thakur

The acronym CMYK (pronounced as the individual letters: CM Y K) stands for the process colors cyan, magenta, yellow, and black. These four process colors are the transparent ink colors that a commercial press uses to recreate the illusion of a full-color photograph or illustration on the printed page. If you look at any printed color image in a magazine, especially if you look at it through a magnifying glass (a “loupe”), you will see separate dots of ink in each of the four colors. These four colors, in varying intensities determined by the dot size and space around the dot, combine together to create the wide range of colors you appear to see.

To get these four colors from the full-color image, the image must be separated into the varying percentages of each of the colors. There are several very sophisticated methods of doing this, and the result is a four color separation.

Desktop color systems and the powerful page layout and art programs are now capable of making four-color separations for us. I can also create a color in my publication to match a color in the photograph. For instance, if I want to print my headlines in the same slate blue as in the model’s tie, the computer could separate the headline color into the four different layers (sometimes called “plates”) as follows: 91%Cyan, 69%Magenta, 9% Yellow, and 2% Black. The photograph itself would be separated into its variations of CMYK. When these four percentages of transparent ink are printed on top of each other, the colors combine to make the full-color photograph and the slate blue of the headlines, all at the same time.

This is different from spot color, where each spot of color is a separate, opaque ink color out of a can, such as red or blue or peach.

What is CLUT?

By Dinesh Thakur

CLUT stands for color look-up table. A CWT is a software palette or set of 256 colors (it’s actually a resource) that resides within the system software and most color-capable applications. On a computer with 8-bit color (those that are only capable of displaying a total of 256 colors), a CWT is a necessary reference to let the computer know which 256 colors out of the available 16.7 million colors (24-bit color) it can use at one time. If you think of all those 16.7 million colors as being a big (ok, very big) box of crayons, you can visualize a CWT as being a small box of handpicked colors that someone has handed you to work with. Many applications give you the option of choosing which 256 colors you want to work with. You often can set up your own palette for each particular file. For instance, if you were painting a picture of a man’s face, a palette of 256 different flesh tones would be more useful than a palette containing 256 colors found in the range between black and burgundy. Take the time to explore your particular application and its documentation for a variable palette feature.

What is CGM (Computer Graphics Metafile)?

By Dinesh Thakur

CGM stands for computer graphics metafile, which is an international standard file format for graphic images. Most CGM files are vector graphics, although it is possible to store raster graphics in the CGM format. The purpose of creating a standard is to enable users of different systems and different programs to exchange the same graphic file. It is extremely difficult, though, to create a standard so strict that it can work seamlessly everywhere. A CGM file created in one program may not necessarily be read by every other program.

The Windows metafile format (WPM) developed by Microsoft Corporation may eventually supplant CGM as the vector graphics standard.

What is CGA (Color Graphics Adapter)?

By Dinesh Thakur

CGA stands for color graphics adapter, the first IBM video card to permit graphics on the screen. We’re lucky they’ve come out with better models, because CGA graphics are gawdawful crude. With a CGA, your screen can show up to 640 dots across by 200 dots up and down, with only one color. Even at that maximum resolution, pictures look really blocky and out of proportion. Pictures will look even more blocky if you want 4 colors on the screen at once, since you’re then limited to 320 dots across and 200 down. If you can tolerate a totally chunky display of 160 by 200 dots, you can get a maximum of 16 colors on a CGA. Wow!

A CGA can display text too, but the characters are fuzzy looking and squished together, so they’re hard to read. And you may see an annoying sparkling effect called snow when you scroll the text. So don’t buy a computer with a CGA. And if someone gives you one, put in a VGA instead.

Many other companies besides IBM have produced video cards that work just like a CGA. Some pcs, including most laptops made prior to 1990, come with built-in CGA-Compatible circuitry. These variations are generically referred to as CGAs or CGA systems, trademarks notwithstanding. And since people don’t look at the video circuits too often, they generally end up using the term CGA to refer to their monitor, as in “I have a CGA screen.”

What is double buffering?

By Dinesh Thakur

A technique called double buffering permits one set of data to be used while another is collected. It is used with graphics displays, where one frame buffer holds the current screen image while another acquires the bits that will make up the next image. When it is ready, the buffers are switched, the new screen is displayed, and the process continues. 

This reduces the minimum time between successive frames to the time required to switch buffers, rather than the time required to RENDER a whole frame, so avoiding a lengthy dark space between frames.

In a typical situation, a processor will be capable of producing data several orders of magnitude faster than a peripheral can accept it. In order to make most efficient use of the processor, the data will be placed in a buffer and its location made known to the peripheral. The peripheral then proceeds to empty the buffer while the processor is freed for other work.

What is Bump Mapping?

By Dinesh Thakur

Bump Mapping: An extension of the technique Of TEXTURE MAPPING to create more realistic 3D images, in which an additional BITMAP (the bump map) applied to a surface contains not colour data but small displacements to be applied to the surface normal at each point. After the image is rendered, these displacements alter the angles of reflected rays in such a way as to convey the illusion of surface relief, even though the surface actually remains completely smooth.

What is Bitmap and Bitmap Editor?

By Dinesh Thakur

Bitmap: A table of digital BITS used to represent, for example, a picture or a text character, each bit in the table being interpreted as the presence or absence of a screen PIXEL or a printed dot. The principle can be illustrated by the following table, which represents the letter Z as a 6 x 6 table of bits:

1  1  1 1 1 1

0 0 0 0 1 0

0 0 0 1 0 0

0 0 1 0 0 0

0 1 0 0 0 0

1 1 1  1  1 1

Bitmap Editor: The generic name for programs, such as Adobe’s PHOTOSHOP, whose function is to create and manipulate BITMAPPED images: that is files in which pictures are stored as a collection of individual PIXELS rather than as geometric descriptions. bitmap editor enables its user to change the colour of individual pixels or whole areas of pixels at once, using a variety of tools that mimic the effect of paintbrushes, pencils, spray cans and more. Typical bitmap editors also support a variety of graphics FILTER operations, such as EDGE ENHANCEMENT that can be applied automatically to the whole image.

What is Bitmapped Display?

By Dinesh Thakur

Bitmapped Display: Strictly, a display in which each PIXEL on the screen is represented by a BIT stored in VIDEO MEMORY which would limit its applicability to black-and-white images only. More frequently used, however, to describe any display in which each pixel corresponds to a byte or word in video memory, which covers all contemporary computer colour displays. The term was coined in distinction to the now-obsolete VECTOR DISPLAY, which drew lines instead of pixels.

What is Bit Block Transfer?

By Dinesh Thakur

Bit Block Transfer (bitblt, bitblit): An operation used in computer graphics programming that moves a block of bits en masse from one location in memory to another. If these bits represent display pixels, the effect is to move part of an image from one place to another, and so bitblt is much used in graphical user interface code to display WINDOWS, ICONS and FONT characters quickly. Because this operation is used so extensively, many modern microprocessors provide special instructions to speed it up and a hardware GRAPHICS ACCELERATOR usually contains a dedicated unit called a BLITTER that performs the operation as quickly as possible.

What is bitmapped font?

By Dinesh Thakur

Bitmapped Font, Bitmap Font: A character FONT in which each individual letter form is stored as a table of PIXELS (a picture), in contrast to an OUTLINE FONT where each character is stored as a set of lines or strokes (a description of how to draw the character). Bitmapped fonts are fast and easy to RENDER onto a screen or printer – by simply copying the bits for the character – and for this reason were preferred on older computer systems (up to and including MS-DOS PCs) that used CHARACTER-BASED displays.


Bitmapped fonts render correctly only at the size they were created: to enlarge or reduce their characters involves duplicating or removing pixels, which gives the letters an unattractive jaggy appearance. In contrast, outline fonts can be scaled to any size (above a minimum) with little loss of quality and hence they have almost entirely displaced bitmapped fonts, except for applications such as instruments and hand-held computers with small fixed-size displays. Examples of bitmapped fonts include the fixed-pitch Courier and MS Serif fonts supplied with Windows.

All fonts (typefaces) that you see on the screen are bitmapped. That’s the only way the computer can display the typeface on the screen, since the screen is composed of dots (pixels). Some fonts have no other information to them than the bitmapped display you see on the screen, while other fonts have additional data that is used by the printer to print the typeface smoothly on a page (outline, or scalable fonts).

What is bitmap?

By Dinesh Thakur

A bitmap is an image or shape of any kind-a picture, a text character, a photo-that’s composed of a collection of tiny individual dots. A wild landscape on your screen is a bitmapped graphic, or simply a bitmap. Remember that whatever you see on the screen is composed of tiny dots called pixels. When you make a big swipe across the screen in a paint program with your computerized “brush,” all that really happens is that you turn some of those pixels on and some off. You can then edit that bitmapped swipe dot by dot; that is, you can change any of the pixels in the image. Bitmaps can be created by a scanner, which converts drawings and photographs into electronic form, or by a human artist (like you) working with a paint program.

A computer screen is made up of thousands of dots of light, called pixels (short for picture elements). A single pixel is composed of up to three rays of light, red, blue, and green, blended into a single dot on-screen. By combining these rays and changing their intensity, virtually any color can be displayed on-screen. The number of bits required to display a single pixel onscreen varies by the total number of colors a particular monitor can display. The larger the number of possible colors, the larger the number of bits’ required to describe the exact color needed. Regardless of the actual number of bits required, a bit map is a series of these bits stored in memory, which form a pattern when read left to right, top to bottom. When decoded by the computer and displayed as pixels on-screen, this pattern forms the image of a picture.

The simplest bitmaps are monochrome, which have only one color against a background. For these, the computer needs just a single bit of information for each pixel (remember, a bit is the smallest unit of data the computer recognizes). One bit is all it takes to turn the dot off (black) or on (white). To produce the image you see, the bits get “mapped” to the pixels on the screen in a pattern that displays the image.

In images containing more than black and white, you need more than one bit to specify the colors or shades of gray of each dot in the image. Multicolor images are bitmaps also. An image that can have many different colors or shades of gray is called a “deep bitmap,” while a monochrome bitmap is known as a “bilevel bitmap.” The “depth” of a bitmap-how many colors or shades it can contain – has a huge impact on how much memory and/or disk space the image consumes. A 256-color bitmap needs 8 times as much information, and thus disk space and memory, as a monochrome bitmap.

The resolution of a bitmapped image depends on the application or scanner you use to create the image, and the resolution setting you choose at the time. It’s common to find bitmapped images with resolutions of 72 dots per inch (dpi), 144 dpi, 300 dpi, or even 600 dpi. A bitmap’s resolution is permanently fixed-a bitmapped graphic created at 72 dpi will print at 72 dpi even on a 300 dpi printer such as the LaserWriter. On the other hand, you can never exceed the resolution of your output device (the screen, printer, or what have you); even though you scanned an image at 600 dpi, it still only prints at 300 dpi on a LaserWriter, since that’s the LaserWriter’s top resolution.

You can contrast bitmapped images with vector or object-oriented images, in which the image is represented by a mathematical description of the shapes involved. You can edit the shapes of an object graphic, but not the individual dots. On the other hand, object-oriented graphics are always displayed or printed at the maximum resolution of the output device. But keep in mind that an object-oriented graphic is still displayed as a bitmap on the screen.

Bit-mapped fonts and bit-mapped graphics use pixels to form pictures or letters. However, because of the number of bits required to encode a single pixel, bit-mapped fonts and graphics consume a great deal of memory. In comparison, trying to create a perfect circle by coloring the squares on a piece of graph paper demonstrates the problems inherent with this method of displaying text and graphics. Because a computer screen is layed out in a grid of dots (pixels) like graph paper, a distortion will show up along the angled and curved lines in an image. This distortion is called “jaggies” or “aliasing.”

What is anode?

By Dinesh Thakur

The positively charged ELECTRODE that attracts ELECTRONS within a current-consuming device such as an electrolytic cell, discharge tube or valve. In a current-producing BATTERY, the anode is the electrode that receives electrons internally and hence is connected to the external negative terminal.

What is analogue or analog video?

By Dinesh Thakur

Analogue video: A video signal that is captured transmitted and stored as a continuously varying voltage, rather than as a stream of bits as in digital video. Up until the advent of digital TV in the late 1990S, television worked by transmitted analogue video signals, and older video tape recorders such as VHS, PAL, Betamax and Umatic all store analogue signals.

The disadvantage of analogue video is that it is prone to noise interference, while its advantage is its great density: a domestic 3- hour VHS cassette holds the equivalent of 16 gigabytes of digital data.

What is alpha channel?

By Dinesh Thakur

An extra layer of information stored in a digital picture to describe transparency or opacity. For each pixel, the alpha channel stores an extra value called alpha, in addition to its red, blue and green values, which indicates the degree of transparency of that pixel.

The display software then mixes the colour of this pixel with the background colour in proportion to its alpha value (so an alpha value of 0.5 would display half foreground and half background), a process called alpha blending.

An alpha channel enables special effects such as blurring or tinting of the background as a transparent object passes across it, and fog or mist effects to suggest distance. Alpha blending is supported as a hardware function by advanced graphics accelerators (AGP).

What is Aspect ratio?

By Dinesh Thakur

Aspect ratiois a fancy term for “proportion,” or the ratio of width to height. for example 4:3 for a computer screen. For instance, if a direction in a software manual tells you to “hold down the Shift key while you resize a graphic in order to maintain the aspect ratio,” it simply means that if youdon’thold down the Shift key you will stretch the image out of proportion.

Some combinations of computers and printers have trouble maintaining the correctaspect ratio when the image goes from the screen to the printer, or when the image is transferred from one system to another, so the aspect ratio can be an important specification to consider when choosing hardware.

The aspect ratio of the screen determines the most efficient screen RESOLUTIONS and the most desirable shape for individual PIXELS, all of which may have to change upon the introduction of HIGH DEFINITION TELEVISION.

What is Antialiasing?

By Dinesh Thakur

When text or a graphic image is displayed on amonitor,or screen, the smoothness of the edges is limited by the resolution of the screen, which means the edges tend to be a little jagged. This jaggedness is also called aliasing.

There are a variety of techniques used to reduce the jaggies, or the aliasing of text and graphic images, to fool our eyes into thinking the edge is smoother. For instance, in animage editingprogram you can blur the edges, or shade along the lines to make the dark-to-light transition less distinct.Anti-aliasing, then, means to use one of these techniques to smooth out the rough edges (the aliasing).

Antialiasing: A technique employed in computer GRAPHICS to smooth the jagged appearance of text and lines by applying varying shades of colour. Consider a black diagonal line drawn on a white screen background: on a low RESOLUTION display it will appear stepped like a staircase because the positions of screen pixels will not coincide exactly with the desired path of the line. On a screen that can display shades of grey, anti aliasing involves coloring each pixel black if it lies wholly within the line, white if it lies wholly outside the line, but otherwise a shade of grey proportional to the degree with which it overlaps the line.

The same principle works with any foreground and background colour combination, by exploiting a property of the human eye that expects the edges of objects to display some tonal gradation due to light and shadow. Antialiased text is a feature of most sophisticated text processing and design software.

What is aliasing?

By Dinesh Thakur

Aliasing

Aliasing has two definitions, depending on whether you’re talking about pictures or sounds.

When a diagonal line or a curved arc drawn on the screen looks as if it was made out of bricks, when it looks like stair steps instead of a slide, the effect is technically called aliasing. Most of us would say it had the jaggies. It can be ameliorated by the technique of ANTIALIASING.

The phenomenon by which a digitized sound sample may pick up unwanted spurious frequencies. It affects digitally reproduced sound, which is the kind of sound your computer probably makes. (The beeps you hear from a standard PC speaker aren’t digital, but a sound board you plug into your PC creates sound digitally; the Mac has built-in digital sound.)

Digital sound is based on a sequence of numbers (digits) that are converted into sound waves by electronic circuits. The computer has to guess at what sound to make between each number in the sequence. If the time between each value is too long (if the “sampling rate” is low), you hear the mistaken guesses as a metallic, static distortion called aliasing. To squelch aliasing, you need a soundcard with a sampling rate of around 40 kilohertz (40,000 times a second) or higher.

Both these phenomena result from sampling the data at a frequency below its NYQUIST FREQUENCY: that is, displaying a line on a screen of too Iowa resolution or sampling the sound at too Iowa frequency. In fact aliasing is a potential source of distortion when sampling any form of data, another example being the optical illusion that wheels are rotating backwards often seen when old movies are shown on television.

What is 32-bit color?

By Dinesh Thakur

On a color monitor, each pixel has three dots arranged in a triad-red, green, and one blue dot. Each dot can deal with a maximum of 8 bits, which makes a total of 24 bits per pixel. With the possibility of combining the 256 levels of color in each of the three color dots, 24-bit color gives you the awesome potential of 16.7 million colors on your screen (256 times 3). Many of these colors differ so slightly that even the most acute observer couldn’t tell the difference between them. Simply stated: 16 million colors is more than enough. (How do you get black and white if there are three colored dots? If all dots are on, the pixel is white; if all dots are off, the pixel is black.)

Now, you will often hear of 32-bit color, which there isn’t, really. Those other 8 bits don’t offer any extra color, but they do offer the capacity for masking and channeling.

What is Grayscale?

By Dinesh Thakur

On a grayscale monitor, each pixel can accept from 1 to 8 bits of data, which will show from 1 to 256 shades of gray.

If there are 2 bits per pixel, there are four possible combinations of on and off: on/on, off/off, on/off, and off/on. Each of these combinations displays a different shade of gray (including black and white).

If there are 4 bits per pixel (24), you will have 16 levels of gray

If there are 8 bits per pixel, there are 256 possible combinations (28). This is the maximum number of grays possible on any grayscale monitor, which is plenty because our eyes can’t distinguish more than that number of grays anyway.

What is Monochrome?

By Dinesh Thakur

If an item is monochrome, that means it uses only one color on a differently colored background. In a monochrome monitor, these pixels have only one color phosphor. The picture is created with, say, black dots (or lines) against a white background. A monochrome image pixel can have two values, on (white) or off (black), and this can be represented by 1-bit as either 0 or 1. Most printers are monochrome, meaning they only print black toner on white paper.

If an image is One-bit that means 1-bit of information is sent to the pixel on the screen. That bit can turn the pixel on (white) or off (black). All 1-bit images are black-and-white. On amonochrome monitor, the pixels can’t deal with more than just that one bit of data so that’s all you can ever get is black and white. 

Data Compression – What is the Data Compression? Explain Lossless Compression and Lossy Compression.

By Dinesh Thakur

Data compression is the function of presentation layer in OSI reference model. Compression is often used to maximize the use of bandwidth across a network or to optimize disk space when saving data.

There are two general types of compression algorithms:


1. Lossless compression

2. Lossy compression

                         Types of Compression

Lossless Compression

Lossless compression compresses the data in such a way that when data is decompressed it is exactly the same as it was before compression i.e. there is no loss of data.

A lossless compression is used to compress file data such as executable code, text files, and numeric data, because programs that process such file data cannot tolerate mistakes in the data.

Lossless compression will typically not compress file as much as lossy compression techniques and may take more processing power to accomplish the compression.

Lossless Compression Algorithms

The various algorithms used to implement lossless data compression are :


1. Run length encoding

2. Differential pulse code modulation

3. Dictionary based encoding

1. Run length encoding

• This method replaces the consecutive occurrences of a given symbol with only one copy of the symbol along with a count of how many times that symbol occurs. Hence the names ‘run length’.

• For example, the string AAABBCDDDD would be encoded as 3A2BIC4D.

• A real life example where run-length encoding is quite effective is the fax machine. Most faxes are white sheets with the occasional black text. So, a run-length encoding scheme can take each line and transmit a code for while then the number of pixels, then the code for black and the number of pixels and so on.

• This method of compression must be used carefully. If there is not a lot of repetition in the data then it is possible the run length encoding scheme would actually increase the size of a file.

2. Differential pulse code modulation

• In this method first a reference symbol is placed. Then for each symbol in the data, we place the difference between that symbol and the reference symbol used.

• For example, using symbol A as reference symbol, the string AAABBC DDDD would be encoded as AOOOl123333, since A is the same as reference symbol, B has a difference of 1 from the reference symbol and so on.

3. Dictionary based encoding

• One of the best known dictionary based encoding algorithms is Lempel-Ziv (LZ) compression algorithm.

• This method is also known as substitution coder.

• In this method, a dictionary (table) of variable length strings (common phrases) is built.

• This dictionary contains almost every string that is expected to occur in data.

• When any of these strings occur in the data, then they are replaced with the corresponding index to the dictionary.

• In this method, instead of working with individual characters in text data, we treat each word as a string and output the index in the dictionary for that word.

• For example, let us say that the word “compression” has the index 4978 in one particular dictionary; it is the 4978th word is usr/share/dict/words. To compress a body of text, each time the string “compression” appears, it would be replaced by 4978.

Lossy Compression

Lossy compression is the one that does not promise that the data received is exactly the same as data send i.e. the data may be lost.

This is because a lossy algorithm removes information that it cannot later restore.

Lossy algorithms are used to compress still images, video and audio.

Lossy algorithms typically achieve much better compression ratios than the lossless algorithms.

Audio Compression

• Audio compression is used for speech or music.

• For speech, we need to compress a 64-KHz digitized signal; For music, we need to compress a 1.411.MHz signal


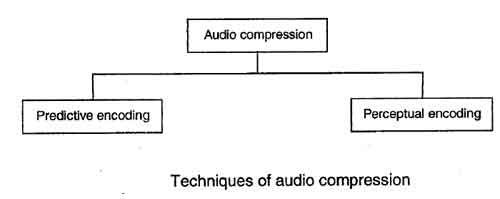
• Two types of techniques are used for audio compression:


1. Predictive encoding

2. Perceptual encoding

                        Techniques of Audio Compression

Predictive encoding

• In predictive encoding, the differences between the samples are encoded instead of encoding all the sampled values.

• This type of compression is normally used for speech.

• Several standards have been defined such as GSM (13 kbps), G. 729 (8 kbps), and G.723.3 (6.4 or 5.3 kbps).

Perceptual encoding

• Perceptual encoding scheme is used to create a CD-quality audio that requires a transmission bandwidth of 1.411 Mbps.

• MP3 (MPEG audio layer 3), a part of MPEG standard uses this perceptual encoding.

• Perceptual encoding is based on the science of psychoacoustics, a study of how people perceive sound.

• The perceptual encoding exploits certain flaws in the human auditory system to encode a signal in such a way that it sounds the same to a human listener, even if it looks quite different on an oscilloscope.

• The key property of perceptual coding is that some sounds can mask other sound. For example, imagine that you are broadcasting a live flute concert and all of a sudden someone starts striking a hammer on a metal sheet. You will not be able to hear the flute any more. Its sound has been masked by the hammer.

• Such a technique explained above is called frequency masking-the ability of a loud sound in one frequency band to hide a softer sound in another frequency band that would have been audible in the absence of the loud sound.

• Masking can also be done on the basis of time. For example: Even if the hammer is not striking on a metal sheet, the flute will be inaudible for a short period of time because the ears turn down its gain when they start and take a finite time to turn up again.

• Thus, a loud sound can numb our ears for a short time even after the sound has stopped. This effect is called temporal masking.

MP3

• MP3 uses these two phenomena, i.e. frequency masking and temporal masking to compress audio signals.

• In such a system, the technique analyzes and divides the spectrum into several groups. Zero bits are allocated to the frequency ranges that are totally masked.

• A small number of bits are allocated to the frequency ranges that are partially masked.

• A larger number. of bits are allocated to the frequency ranges that are not masked.

• Based on the range of frequencies in the original analog audio, MP3 produces three data rates: 96kbps, 128 kbps and 160 kbps.

What is LCD (Liquid Crystal Display)?

By Dinesh Thakur

LCD stands for liquid crystal display. Your digital watch uses an LCD to show you the time, and most portable computers use an LCD to display the screen. There is actually a liquid compound, liquid crystals, sandwiched between two grids of electrodes. The electrodes can selectively turn on the different cells or pixels in the grid to create the image you see.

An LCD consists of a layer of gooey material-the liquid crystals themselves-between two polarizing filters. These filters are sheets of plastic that let through only those light waves traveling parallel to a particular plane. Between the filters and the liquid crystal layer runs a thin grid of transparent electrodes.

The two polarizing filters are arranged so that their polarizing planes are at right angles. That setup would block light from passing through except for the fact that the liquid crystal molecules are “twisted.” They pivot the light coming through the first filter, aligning the light with the polarizing plane of the second filter. Since the light makes it all the way through both filters, the screen looks light in color. However, the liquid crystal molecules that are controlled by a particular electrode become untwisted when a current is applied. Light no longer passes through the second filter, and you see a black or colored dot on the screen. Most LCDs are passive matrix designs, in which each dot, or pixel, on the screen shares electrodes with other dots. Active matrix designs, which produce much brighter, more colorful images, have a separate transistor for each pixel, which allows greater control over the current for that pixel.

In “supertwist” LCDS, the liquid crystal molecules have a more pronounced twist than in the ordinary screens, improving contrast. The chemist’s term “nematic” refers to the molecular structure of the crystals-all LCDs use nematic crystals, so this term is used in ads just to impress you.

Although you can read an LCD screen in room light, the contrast is mediocre at best. Today, the LCD screens on most computers are illuminated by backlighting or edge lighting (fluorescent-type lights mounted behind the screen or along either side).


What is transformation? Type of transformation

By Dinesh Thakur

What is transformation? In  many  cases  a  complex  picture  can  always  be  treated as  a  combination  of  straight line, circles, ellipse etc., and if we are able to generate these basic figures, we can also generate combinations of them.  Once we  have drawn these pictures, the  need arises  to transform these pictures. 

We are  not essentially modifying the pictures, but a picture  in the center of the screen needs to be shifted to the top left hand corner, say, or a picture  needs to be increased to twice it’s size or a picture is to be turned through 900 .  In all these  cases, it  is  possible  to view  the  new  picture  as  really a  new  one  and use  algorithms  to  draw  them, but a better  method is, given their present  form, try to get  their  new counter  parts by operating on the existing data.  This concept is called transformation. 

The three basic transformations are

(i)                 Translation 

(ii)               rotation  and

(iii)             Scaling.

Translation  refers  to the  shifting of  a  point  to some  other  place, whose  distance  with regard to the  present  point  is known. Rotation as  the  name  suggests  is  to rotate  a  point  about an axis.   The axis can be any of the coordinates or simply any other specified line  also. Scaling is the concept of increasing (or decreasing) the size of a picture. (in one or  in either directions.  When  it  is done  in both directions, the  increase or decrease  in both directions  need not be same)   To change the size of the picture, we  increase or decrease  the distance between the end points of the picture and also change the intermediate points  are per requirements.

Translation: 

Consider a point P(x1 , y1 ) to be translated to another point Q(x2 , y2 ).  If we know  the point  value (x2, y2) we can directly shift to Q by displaying the pixel (x2, y2).  On the  other  hand, suppose we only know that we  want to shift by a distance of Tx along  x axis  and Ty along  Y axis.   Then obviously the coordinates can be derived by  x2 =x1 +Tx and  Y2 = y1 + Ty .

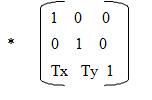
Suppose  we  want  to shift  a  triangle  with  coordinates  at  A(20,10), B(30,100) and C(40,70).   The  shifting to be  done  by  20 units  along  x  axis  and 10 units  along  y  axis. Then the new triangle will be at A1 (20+20, 10+10) B1  (30+20, 10+10) C1 (40+20, 70+10)  In the matrix form [x2 y2 1] = [x1 y1 1]    

                                                              Matrix

Rotation

Suppose we want to rotate a point (x1 y1) clockwise through an angle? about the origin of the coordinate system. Then mathematically we can show that

x2 = x1cos ? + y1sin? and

y2 = x1sin? – y1cos?

These equations become applicable only if the rotation is about the origin.

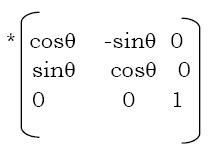
In the matrix for [x2 y2 1] = [x1 y1 1]

              Matrix 1

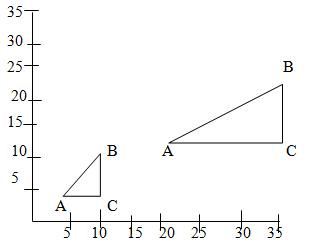
Scaling : Suppose we want the point  (x1 y1)  to be scaled by a factor sx and by a factor sy along y direction.

Then the new coordinates become  : x2 = x1 * sx and  y2 = y1 * sy

                Matrix 2

(Note that scaling a point physically means  shifting  a point away.   It does  not   magnify

the  point.   But  when  a  picture  is  scaled, each  of  the  points  are  scaled differently  and  hence the dimensions of the picture changes.)

Difference between shadow mask and beam penetration method?

By Dinesh Thakur

Both methods are used in color CRT monitors. Beam penetration method is used for random scan monitors. In beam penetration two layers of phosphor red and green are coated inside CRT screen, the display of color depend on how far electron excites outer red layer, then green layer. This method can produce four colors i.e red ,green, orange, yellow. This is less costly method as compared to shadow mask.

 But it can produce less colors as compared to shadow mask. The quality of picture is also poor as compared to shadow mask. Shadow mask is used for raster scan systems. It can produce wide variety of colors .There is three phosphor color dots at each pixel position. One phosphor dot emit red light, another emit green light ,third emit blue light. Three guns one for each color are used. Three beams pass through holes in shadow mask, and a small color spot on screen is appeared. Shadow masks are used as display device for home computers, color tv set etc

Differentiate between raster scan and random scan displays.

By Dinesh Thakur

The most common form of graphics monitor employing a CRT is the raster scan display, based on television technology. In a raster scan system, the electron beam is swept across the screen, one row at a time from top to bottom. As the electron beam moves across each row, the beam intensity is turned on and off to create a pattern of illuminated spots. Picture definition is stored in a memory area called the refresh buffer or frame buffer.

This memory area holds intensity values for all the screen points. Stored intensity values are then retrieved from the refresh buffer and pointed on the screen one row at a time. Each screen point is referred to as a pixel.


When operated as a random scan display unit, the CRT has the electron beam directed only to the parts of the screen where a picture is to be drawn. Random scan monitors draw a picture one line at a time and for this reason are also known as vector displays. The component lines of a picture can be drawn and refreshed by a random scan system. A pen plotter operates in a similar way and is an example of a random scan, hard copy device.

What are the different techniques used for representing three-dimensional objects?

By Dinesh Thakur

The various techniques used are:


1) Graphics monitors for the display of three-dimensional scenes have been devised using a technique that reflects a CRT image from a vibrating, flexible mirror. In this system, as the mirror vibrates, it changes focal length.


These vibrations are synchronized with the display of an object on a CRT so that each point on the object is reflecting from the mirror into a spatial position corresponding to the distance of that point from a specified viewing position. This allows us to walk around an object or scene and view it from different sides.


2) Another technique for representing three-dimensional objects is displaying stereoscopic views. This method does not produce true three-dimensional images, but it does provide a three dimensional effect by presenting a different view to each eye of an observer so that scenes do appear to have depth. To obtain a stereoscopic projection, we first need to obtain two views of a scene generated from a viewing direction corresponding to each eye.


We can construct the two views as computer-generated scenes with different viewing positions, or we can use a stereo camera pair to photograph some object or scene. When we simultaneously look at the left view withy the left eye and the right view with the right eye, the two images merge into a single image and we perceive a scene with depth. Stereoscopic viewing is also a component in virtual reality systems, where users can step into a scene and interact with the environment.


A headset containing an optical system to generate the stereoscopic view is commonly used in conjunction withy interactive input devices to locate and manipulate objects in the scene. A sensing system in the headset keeps track of the viewer?s position, so that the front and back of objects can be seen as the viewer walks through and interacts with the display.

« Previous Page
Next Page »

Primary Sidebar

Computer Graphics Tutorials

Computer Graphics

  • CG - Home
  • CG - Introduction
  • CG - Applications
  • CG - Applications
  • CG - Raster Vs Random Scan Display
  • CG - Frame Buffer
  • CG - DVST
  • CG - CRT Display
  • CG - DDA
  • CG - Transformation
  • CG - Cathode Ray Tube
  • CG - Bresenham’s Line Algorithm
  • CG - Pixel
  • CG - Data Compression
  • CG - Clipping
  • CG - Shadow Mask CRT
  • CG - Line Drawing Algorithm
  • CG - Text Clipping
  • CG - Refresh Rates
  • CG - CRT/Monitor
  • CG - Interactive Graphics Display
  • CG - Raster Vs Random Scan System
  • CG - Liquid Crystal Display
  • CG - Scan Converting a Line
  • CG - Monitors Types
  • CG - Display Types
  • CG - Sutherland-Hodgeman Clipping
  • CG - Bitmap
  • CG - Antialiasing
  • CG - Refresh Rates
  • CG - Shadow Mask Vs Beam Penetration
  • CG - Scan Converting a Point
  • CG - Image Resolution
  • CG - Double Buffering
  • CG - Raster Vs Random Scan
  • CG - Aspect Ratio
  • CG - Ambient Light
  • CG - Image Processing
  • CG - Interactive Graphics Displayed
  • CG - Shadow Mask CRT
  • CG - Dithering
  • CG - GUI
  • CG - CLUT
  • CG - Graphics
  • CG - Resolutions Types
  • CG - Transformations Types
  • CG - Half-toning Effect
  • CG - VGA
  • CG - Aliasing
  • CG - CGA

Other Links

  • Computer Graphics - PDF Version

Footer

Basic Course

  • Computer Fundamental
  • Computer Networking
  • Operating System
  • Database System
  • Computer Graphics
  • Management System
  • Software Engineering
  • Digital Electronics
  • Electronic Commerce
  • Compiler Design
  • Troubleshooting

Programming

  • Java Programming
  • Structured Query (SQL)
  • C Programming
  • C++ Programming
  • Visual Basic
  • Data Structures
  • Struts 2
  • Java Servlet
  • C# Programming
  • Basic Terms
  • Interviews

World Wide Web

  • Internet
  • Java Script
  • HTML Language
  • Cascading Style Sheet
  • Java Server Pages
  • Wordpress
  • PHP
  • Python Tutorial
  • AngularJS
  • Troubleshooting

 About Us |  Contact Us |  FAQ

Dinesh Thakur is a Technology Columinist and founder of Computer Notes.

Copyright © 2025. All Rights Reserved.

APPLY FOR ONLINE JOB IN BIGGEST CRYPTO COMPANIES
APPLY NOW