• Skip to main content
  • Skip to primary sidebar
  • Skip to secondary sidebar
  • Skip to footer

Computer Notes

Library
    • Computer Fundamental
    • Computer Memory
    • DBMS Tutorial
    • Operating System
    • Computer Networking
    • C Programming
    • C++ Programming
    • Java Programming
    • C# Programming
    • SQL Tutorial
    • Management Tutorial
    • Computer Graphics
    • Compiler Design
    • Style Sheet
    • JavaScript Tutorial
    • Html Tutorial
    • Wordpress Tutorial
    • Python Tutorial
    • PHP Tutorial
    • JSP Tutorial
    • AngularJS Tutorial
    • Data Structures
    • E Commerce Tutorial
    • Visual Basic
    • Structs2 Tutorial
    • Digital Electronics
    • Internet Terms
    • Servlet Tutorial
    • Software Engineering
    • Interviews Questions
    • Basic Terms
    • Troubleshooting
Menu

Header Right

Home » Graphics » Computer Graphics

What are the various methods through which input is recorded in touch panels?

By Dinesh Thakur

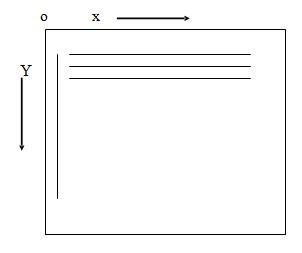
1. Optical Touch Panel: Optical touch panels employ a line of infrared light-emitting diodes (LEDs) along one vertical edge and along one horizontal edge of the frame. The opposite vertical and horizontal edges contain light detectors. These detectors are used to record which beams re interrupted when the panel is touched.


The two crossing beams that are interrupted identify the horizontal and vertical coordinates of the screen position selected. Positions can be selected with an accuracy of about ¼ inch. With closely spaced LEDs, it is possible to break two horizontal or two vertical beams simultaneously. In this case, an average position between the two interrupted beams is recorded.


2. Electrical Touch Panel: An electrical touch panel is constructed with two transparent plates separated by a small distance. One of the plates is coated with a conducting material, and the other plate is coated with a resistive material. When the outer plate is touched, it is forced into contact with the inner plate. This contact creates a voltage drop across the resistive plate that is converted to the coordinate values of the selected screen position.


3. Acoustical Touch Panel: In acoustical touch panels, high-frequency sound waves are generated in the horizontal and vertical directions across a glass plate. Touching the screen causes part of each wave to be reflected from the finger to the emitters. The screen position at the point of contact is calculated from a measurement of the time interval between the transmission of each wave and its reflection to the emitter.

What is image processing? Explain its working principle.

By Dinesh Thakur

It is a technique to modify or interpret existing pictures, such as photographs. Two principal applications of image processing are:


1. Improving picture quality
2. Machine perception of visual information as used in robotics


Working of image processing: To apply image-processing methods, we first digitize a photograph or other picture into an image file. Then digital methods can be applied to rearrange picture parts, to enhance color separations, or to improve the quality of shading. An example of the application of image-processing methods is to enhance the quality of a picture. These techniques are used extensively in commercial art applications that involve the retouching and rearranging of sections of photographs and other artwork. Similar methods are used to analyze satellite photos of the earth and photos of galaxies.

Explain the line drawing algorithm for DDA.

By Dinesh Thakur

Digital Differential Analyzer is a scan conversion line algorithm based on calculating either dy or dx. We sample the line at unit intervals in one coordinate & determine corresponding integer values nearest to the line path for the other coordinate.

The algorithm accepts as input the two endpoint pixel positions. Horizontal & vertical differences between the endpoint positions are assigned to parameters dx & dy. The difference with the greater magnitude determines the increment of the parameter steps. Starting with the pixel position (xa , ya), we determine the offset needed at each step to generate the next pixel position along the line path. We loop through this process „steps? times. If the magnitude of dx is greater that the magnitude of dy & xa is less that xb, the values of the increments in the x & y directions are i & m. It is a faster method of calculating pixel positions. However, the accumulation of round off error in successive additions can cause the calculated pixel positions to draft away from the true line path for long line segments.


What are the various transformations possible in 2-D? Explain any 3 of them.

By Dinesh Thakur

1. Translation: A translation is applied to an object by repositioning it along a straight line path from one coordinate position to another. We translate a 2-D point by adding translation distances tx & ty, to the original coordinate position ( x, y) to move the point to a new position (x? , y?)
X? = x + tx , y? = y + ty.


2. Rotation: A 2-D rotation is applied to an object by repositioning it along a circular path in the xy plane. To generate a rotation, we specify a rotation angle ? and the position (xr , yr) of the rotation point about which the object is to be rotated.
P1 = R . P
Where the rotation matrix is R = cos? – sin ? sin ? cos?


3. Scaling: A scaling transformation alters the size of a.n object. This operation can be carried out for polygons by multiplying the coordinate values (x,y) of each vertex by scaling factors sx & sy to produce the transformed coordinates (x? , y?):
x1 = x.sx , y1 = y.sy

4.Reflection: It is also called as mirror or mirror image . It can be either about x axis or y axis. The object is rotated about 180 degree. Reflection can be done about line.


5. Shearing : It is change of shape of object. It can be in x or y or both directions.

What is clipping? Explain any one clipping algorithm.

By Dinesh Thakur

Any procedure that identifies those portions of a picture that are either inside or outside of a specified region or space is known as clipping. [Read more…] about What is clipping? Explain any one clipping algorithm.

Sutherland-Hodgeman Polygon Clipping

By Dinesh Thakur

In polygon clipping, we use an algorithm that generates one or more closed areas that are then scan converted for the appropriate area fill. The output of a polygon clipper should be a sequence of vertices that define the clipped polygon boundaries. We can correctly clip a polygon by processing the polygon boundary as whole each window edge.

This could be accomplished by processing all polygon vertices against each clip rectangle boundary in turn. Beginning with the initial set of polygon vertices, we could first clip the polygon against the left rectangle boundary to produce a new sequence of vertices. The new set of vertices could then be successively passed to a right boundary clipper and a top boundary clipper. There are four possible cases when processing vertices in sequence around the perimeter of a polygon.


As each pair of adjacent polygon vertices is passed to a window boundary clipper, we make the following tests:


1) if the first vertex is outside the window boundary and the second vertex is inside, both the intersection point of the polygon edge with the window boundary and the second vertex are added to the output vertex list.


2) If both input vertices are inside the window boundary, only the second vertex is added to the output vertex list.


3) If the first vertex is inside the window boundary and the second vertex is outside, only the edge intersection with the window boundary is added to the output vertex list.


4) If both input vertices are outside the window boundary, nothing is added to the output list.

Write a note on text clipping.

By Dinesh Thakur

There are several techniques that can be used to provide text clipping in a graphics package. The clipping technique used will depend on the methods used to generate characters and the requirements of a particular application.

The simplest method for processing character strings relative to a window boundary is to use all-or-none string-clipping strategy. If all of the string is inside the clip window, we keep it. Otherwise, the string is discarded. This procedure is implemented by considering a bounding rectangle around the text pattern. The boundary positions of the rectangle are then compared to the window boundaries, and the string is rejected if there is any overlap. This method produces the fastest text clipping.  

An alternative to rejecting an entire character string that overlaps a window boundary is to use the all-or-none character-clipping strategy. Here we discard only those characters that are not completely inside the window. In this case the boundary limits of individual characters are compared to the window. Any character that either overlaps or is outside a window boundary is clipped.
A final method for handling text clipping is to clip the components of of individual characters. We now treat characters in much the same way that we treated lines. If an individual character overlaps a clip window boundary, we clip off the parts of the character that are outside the window.

What is half-toning effect?

By Dinesh Thakur

Continuous-tone graphs are reproduced for publication in newspapers, magazines & books with a printing process called half toning, & the reproduced pictures are called halftones. For a black and white photograph, each intensity area is reproduced as a series of black circles on white background.

 The diameter of each circle is proportional to darkness required for that intensity region. Darker regions are printed with large circles , Lighter regions are printed with small circles. Books and magazine are printed on high quality paper using 60 to 80 circles of varying diameter per centimeter. Newspaper use lower quality paper and lower resolution.

What is Ambient Light?

By Dinesh Thakur

A surface that is not exposed directly to a light source still will be visible if nearby objects are illuminated. In our basic illumination model, we can set a general level of brightness for a scene. This is a simple way to model the combination of light reflections from various surfaces to produce a uniform illumination called the ambient light, or background light.

Ambient light has no spatial or directional Characteristics. The amount of ambient light incident on each object is a constant for all surfaces and over all directions.

Scan converting a point

By Dinesh Thakur

A mathematical point (x, y) where x and y are real numbers within an image area, needs to be scan converted to a pixel at location (x’, y’). This may be done by making x’ to be the integer part of x, and y’ to be the integer part of y. In other words, x’ = floor(x) and y’ = floor(y),

 where function floor returns the largest integer that is less than or equal to the arguments. Doing so in essence places the origin of a continuous coordinate system for (x, y) at the lower left corner of the pixel grid in the image space. All the points that satisfy x’? x ? x’ + 1 and y’? y ? y’ + 1 are mapped to pixel (x’, y’). Let us take for example a point P1(1.7, 0.8).


It will be represented by pixel (1, 0). Points P2 (2.2, 1.3) and P3(2.8, 1.9) are both represented by pixel (2, 1). Let us take another approach to align the integer values in the coordinate system for (x, y) with the pixel coordinates. Here we can convert (x, y) by making x’ = floor(x + 0.5) and y’ = floor(y + 0.5). This approach places the origin of the coordinate system for (x, y) at the center of pixel(0,0).


All points that satisfy x’- 0.5 ? x ? x’+0.5 and y’- 0.5 ? y ? y’+0.5 are mapped to pixel (x’, y’). This means that points P1 and P2 are now both represented by pixel (2, 1), whereas point P3 is represented by pixel (3, 2).


Scan Converting a Line

By Dinesh Thakur

You know that a line in computer graphics typically refers to a line segment, which is a portion of a straight line that extends indefinitely in opposite directions. You can define a line by its two end points and by the line equation y = mx + c, where m is called the slope and c the y intercept of the line. Let the two end points of a line be P1(x1, y1) and P2(x2, y2). The line equation describes the coordinates of all the points that lie between the two endpoints.

 A simple approach to scan convert a line is to first scan convert P1 and P2 to pixel coordinates (x1’, y1’) and (x2’, y2’) respectively. Then let us set m = (y2’- y1’)/(x2’- x1’) and b = y1’-mx1’. Find |m| and if |m| ? 1, then for every integer value of x between and excluding x1’ and x2’, calculate the corresponding value of y using the equation and scan convert (x, y). If |m| >1, then for every integer value of y between and excluding y1’ and y2’, calculate the corresponding value of x using the equation and scan convert (x, y).


Design criteria of straight lines


From geometry we know that a line, or line segment, can be uniquely specified by two points. From algebra we also know that a line can be specified by a slope, usually given the name m and a y-axis intercept called b. Generally in computer graphics, a line will be specified by two endpoints. But the slope and y-intercept are often calculated as intermediate results for use by most line-drawing algorithms.


The goal of any line drawing algorithm is to construct the best possible approximation of an ideal line given the inherent limitations of a raster display. Before discussing specific line drawing algorithms, it is useful to consider general requirements for such algorithms. Let us see what are the desirable characteristics needed for these lines.


The primary design criteria are as follows


  • Straight lines appear as straight lines
  • Straight lines start and end accurately
  • Displayed lines should have constant brightness along their length, independent of the line length and orientation.
  • Lines should be drawn rapidly

Write Short Note on Digital Differential Analyzer (DDA)

By Dinesh Thakur

DDA algorithm is an incremental scan conversion method. Here we perform calculations at each step using the results from the preceding step. The characteristic of the DDA algorithm is to take unit steps along one coordinate and compute the corresponding values along the other coordinate. The unit steps are always along the coordinate of greatest change, e.g. if dx = 10 and dy = 5, then we would take unit steps along x and compute the steps along y.

 Suppose at step i we have calculated (xi, yi) to be a point on the line. Since the next point (x i+1,y i+1) should satisfy ?y/? x =m where ?y= y i+1–yi and ? x= x i+1–xi , we have y i+1= yi + m? x or x i+1=xi+ ? y/m

 These formulas are used in DDA algorithm as follows. When |m| ? 1, we start with x = x1’? (assuming that x1’ <x2’) and y = y1’, and set ? x =1( i.e., unit increment in the x direction). The y coordinate of each successive point on the line is calculated using y i+1= yi + m.

When |m| >1, we start with x= x1’ and y= y1’ (assuming that y1’ < y2’), set ? y =1 ( i.e., unit increment in the y direction). The x coordinate of each successive point on the line is calculated using x i+1=xi+ 1/m. This process continues until x reaches x2’(for m| ? 1 case )or y reaches y2’ (for m| > 1 case ) and all points are scan converted to pixel points.

The explanation is as follows: In DDA algorithm we have to find the new point xi+1 and yi+1 from the existing points xi and yi. As a first step here we identify the major axis and the minor axis of the line to be drawn. Once the major axis is found we sample the major axis at unit intervals and find the value in the other axis by using the slope equation of the line.

For example if the end points of the line is given as (x1,y1)= (2,2) and (x2, y2)= (9,5). Here we will calculate y2-y1 and x2-x1 to find which one is greater. Here y2-y1 =3 and x2-x1 =7; therefore here the major axis is the x axis. So here we need to sample the x axis at unit intervals i.e.? x = 1 and we will find out the y values for each ? x in the x axis using the slope equation.

 In DDA we need to consider two cases; one is slope of the line less than or equal to one (|m| ? 1)and slope of the line greater than one (m| > 1). When |m| ? 1 means y2-y1 = x2-x1 or y2-y1 <x2-x1.In both these cases we assume x to be the major axis. Therefore we sample x axis at unit intervals and find the y values corresponding to each x value.

We have the slope equation as

? y = m ? x

           y2-y1 = m (x2-x1)

In general terms we can say that y i+1 – yi = m(x i+1 – xi ). But here ? x = 1; therefore the equation reduces to y i+1= yi + m = yi + dy/dx.

When m| > 1 means y2-y1> x2-x1 and therefore we assume y to be the major axis. Here

we sample y axis at unit intervals and find the x values corresponding to each y value. We have the slope equation as

? y = m ? x

y2-y1 = m (x2-x1)

In general terms we can say that y i+1 – yi = m(x i+1 – xi ). But here ? y = 1; therefore the equation reduces to 1 = m(x i+1 – xi). Therefore

x i+1=xi+ 1/m

x i+1=xi+ dx/dy

DDA Algorithm is given below:

procedure DDA( x1, y1, x2, y2: integer);

var

            dx, dy, steps: integer;

            x_inc, y_inc, x, y: real;

begin

            dx := x2 – x1; dy := y2 – y1;

            if abs(dx) > abs(dy) then

            steps := abs(dx); {steps is larger of dx, dy}

else

            steps := abs(dy);

            x_inc := dx/steps; y_inc := dy/steps;

            {either x_inc or y_inc = 1.0, the other is the slope}

            x:=x1; y:=y1;

            set_pixel(round(x), round(y));

            for i := 1 to steps do

begin

             x := x + x_inc;

             y := y + y_inc;

              set_pixel(round(x), round(y));

end;

end; {DDA}

The DDA algorithm is faster than the direct use of the line equation since it calculates points on the line without any floating point multiplication.

Advantages of DDA Algorithm

1. It is the simplest algorithm and it does not require special skills for implementation.
2. It is a faster method for calculating pixel positions than the direct use of equation y = mx + b. It eliminates the multiplication in the equation by making use of raster characteristics, so that appropriate increments are applied in the x or v direction to find the pixel positions along the line path.

Disadvantages of DDAAlgorithm

1. Floating point arithmetic in DDA algorithm is still time-consuming.
2. The algorithm is orientation dependent. Hence end point accuracy is poor.

Let us see few examples to illustrate this algorithm.


Consider the line from (0,0) to (4,6). Use the simple DDA algorithm to rasterize this line.


Sol. Evaluating steps 1 to 5 in the DDA algorithm we have


Xl = 0                          Y1 = 0

X2 = 4                          Y2 = 6

Length = |Y2-Y1l = 6

                             ∆X = |X2– Xl | / Length

                                 =       4

                                           6

                             ∆Y = |Y2– Yl | / Length

                                   = 6/6=1

Initial value for

                               X = 0 + 0.5 * Sign (4) = 0.5

                                                                 6

                               Y = 0 + 0.5 * Sign (1) = 0.5


Tabulating the results of each iteration in the step 6 we get,

                         DDA Algorithm

                         DDA-Algo

                                             Result for a simple DDA


The results are plotted as shown in the Fig. It shows that the rasterized line lies to both sides of the actual line, i.e. the algorithm is orientation dependent.


Example 2 Consider the line from (0, 0) to (-6, -6). Use the simple DDA algorithm line.


Sol. Evaluating steps 1 to 5 in the DDA algorithm we have


Xl = 0                          Y1 = 0

X2 = – 6                       Y2 = – 6                  

Length = l X2-X1l |Y2-Y1l = 6

                           ∆X = ∆Y = -1

Initial values for

                                       X = 0 + 0.5 * Sign (-1) =-0.5

                                       Y = 0 + 0.5 * Sign (-1) =-0.5

Tabulating the results of each iteration in the step 6 we get,

                             DDA Algorithm Line

                             DDA Algorithm Lines

                                                Result for simple DDA

The results are plotted as shown in the Fig. It shows that the rasterized line lies on the actual line and it is 45° line.


Bresenham’s Line Drawing Algorithm.

By Dinesh Thakur

You know that DDA algorithm is an incremental scan conversion method which performs calculations at each step using the results from the preceding step. Here we are going to discover an accurate and efficient raster line generating algorithm, the Bresenham’s line-drawing algorithm.

This algorithm was developed by Jack E. Bresenham in 1962 at IBM. As stated above, in this lecture, I will explain how to draw lines using the Bresenham’s line-drawingalgorithm. And then show you the complete line drawing function. Before we begin on this topic, a revision of the concepts developed earlier like scan conversion methods and rasterization may be helpful. Once we finish this aspect, we will proceed towards exposition of items listed in the synopsis.

In particular, we will emphasize the following

(a) The working of Bresenham’s algorithm.

(b) Implementation of the Bresenham’s algorithm.

The working of Bresenham’s algorithm The following is an explanation of how the Bresenham’s line-drawing algorithm works, rather than exact implementation.

                   Bresenhams line drawing Algorithm

Let’s take a look at this image. One thing to note here is that it is impossible to draw the true line that we want because of the pixel spacing. Putting it in other words, there’s no enough precision for drawing true lines on a PC monitor especially when dealing with low resolutions. The Bresenham’s line-drawing algorithm is based on drawing an approximation of the true line. 

The true line is indicated in bright color, and its approximation is indicated in black pixels. In this example the starting point of the line is located exactly at 0, 0 and the ending point of the line is located exactly at 9, 6. Now let discuss the way in which this algorithm works. First it decides which axis is the major axis and which is the minor axis.

The major axis is longer than the minor axis. On this picture illustrated above the major axis is the X axis. Each iteration progresses the current value of the major axis (starting from the original position), by exactly one pixel. Then it decides which pixel on the minor axis is appropriate for the current pixel of the major axis. Now how can you approximate the right pixel on the minor axis that matches the pixel on the major axis?

That’s what Bresenham’s line-drawing algorithm is all about. And it does so by checking which pixel’s center is closer to the true line. Now you take a closer look at the picture. The center of each pixel is marked with a dot. The algorithm takes the coordinates of that dot and compares it to the true line. If the span from the center of the pixel to the true line is less or equal to 0.5, the pixel is drawn at that location. That span is more generally known as the error term.

You might think of using floating variables but you can see that the whole algorithm is done in straight integer math with no multiplication or division in the main loops(no fixed point math either). Now how is it possible? Basically, during each iteration through the main drawing loop the error term is tossed around to identify the right pixel as close as possible to the true line. Let’s consider these two deltas between the length and height of the line: dx = x1 – x0; dy = y1 – y0; 

This is a matter of precision and since we’re working with integers you will need to scale the deltas by 2 generating two new values: dx2 = dx*2; dy2 = dy*2; These are the values that will be used to change the error term. Why do you scale the deltas? That’s because the error term must be first initialized to 0.5 and that cannot be done using an integer. Finally the scaled values must be subtracted by either dx or dy (the original, non-scaled delta values) depending on what the major axis is (either x or y).

The implementation of Bresenham’s algorithm

The function given below handles all lines and implements the complete Bresenham’s algorithm.

function line(x0, x1, y0, y1)

boolean steep := abs(y1 – y0) > abs(x1 – x0)

if steep then

swap(x0, y0)

swap(x1, y1)

if x0 > x1 then

swap(x0, x1)

swap(y0, y1)

int deltax := x1 – x0

int deltay := abs(y1 – y0)

real error := 0

real deltaerr := deltay / deltax

int y := y0

if y0 < y1 then ystep := 1 else ystep := -1

for x from x0 to x1

if steep then plot(y,x) else plot(x,y)

error := error + deltaerr

if error ? 0.5

y := y + ystep

error := error – 1.0

Note:-To draw lines with a steeper slope, we take advantage of the fact that a steep line can be reflected across the line y=x to obtain a line with a small slope. The effect is to switch the x and y variables throughout, including switching the parameters to plot.


Cathode Ray Tube (CRT/Monitor)

By Dinesh Thakur

One of the basic and commonly used display devices is Cathode Ray Tube (CRT). A cathode ray tube is based on the simple concept that an electronic beam, when hits a phosphorescent surface, produces a beam of light (momentarily – though we later describe surfaces that produce light intensities lashing over a period of time).

 Further, the beam of light itself can be focused to any point on the screen by using suitable electronic / magnetic fields. The direction and intensity of the fields will allow one to determine the extent of the defection of the beam. Further these electronic / magnetic fields can be easily manipulated by using suitable electric fields with this background. In following section we describe the structure and working of the simple CRT.


Simple CRT makes use of a conical glass tube. At the narrow end of the glass tube an electronic gun is kept. This gun generates electrons that will be made to pass through the magnetic system called yoke. This magnetic system is used for making the electronic beam to fall throughout the broad surface of the glass tube. The broad surface of the glass tube contains a single coat of high quality phosphorus. This reflects the electronic beam makes it to fall on the computer screen.


          cathod Ray Tube

A pair of focusing grids – one horizontal and another vertical does the actual focusing of the electronic beam on to the screen. Electronic or magnetic fields operate these grids. Depending on the direction (positive or negative) and the intensity of the fields applied to them, the beam is deflected horizontally (or vertically) and thus, by using a suitable combination of these focusing grids; the beam can be focused to any point on the screen.


So, we now have a mechanism wherein any point on the screen can be illuminated (or made dark by simply switching off the beam). Hence, from a graphics point of view, any picture can be traced on the screen by the electron beam by suitably and continuously manipulating the focusing grids and we get to see the picture on the screen “A basic graphic picture” of course, since the picture produced vanishes once the beam is removed, to give the effect to continuity, we have to keep the beam retracing the picture continuously – (Refreshing).

How are refresh rates calculated? And What is the Importance of Refresh Rates

By Dinesh Thakur

Factors in determining refresh rates

A refresh rate is dependent upon a monitor’s horizontal scanning frequency and the number of horizontal lines displayed.The horizontal scanning frequency is the number of times the electron beam sweeps one line and returns to the beginning of the next in one second. Horizontal scanning frequency is measured in kilohertz (kHz).

 A monitor with a horizontal scanning frequency of 110 kHz means 110,000 lines are scanned per second. The number of horizontal lines on the screen depends upon the monitor’s resolution. If a monitor is set to a resolution of 1024 x 768 then there are 768 horizontal lines (1024 is the number of pixels on one line).

For a monitor set to a 1280 x 1024 resolution, there are 1024 horizontal lines. Additionally, the time it takes for the electron beam to return to the top of the screen and begin scanning again must be taken into account. This is roughly 5% of the time it takes to scan the entire screen. Therefore, the total is multiplied by 0.95 to calculate the maximum refresh rate.

Calculate maximum refresh rates

The following formula is used to calculate maximum refresh rates

fV = fH / # of horizontal lines x 0.95

fV = vertical scanning frequency (refresh rate)

fH = horizontal scanning frequency

Example: A monitor with a horizontal scanning frequency of 96 kHz at a resolution of 1280 x 1024 would have the following refresh rate based on the calculation above.

fV = 96,000 / 1024 x 0.95

fV = 89.06

This figure is rounded down to produce a maximum refresh rate of 89Hz.

If the same monitor is set to a resolution of 1600 x 1200, then the equation will be as follows:

fV = 96,000 / 1200 x 0.95

fV = 76

The maximum refresh rate at this resolution is 76 Hz.

Importance of Refresh Rates 

When choosing a monitor, one of the factors that the customer usually considers is the refresh rate. A high refresh rate is important in providing a clear picture and avoiding eye fatigue.

An image appears on screen when electron beams strike the surface of the screen in a zig-zag pattern. A refresh rate is the number of times a screen is redrawn in one second and is measured in Hertz (Hz). Therefore, a monitor with a refresh rate of 85 Hz is redrawn 85 times per second.

A monitor should be “flicker-free meaning that the image is redrawn quickly enough so that the user cannot detect flicker, a source of eye strain. Today, a refresh rate of 75 Hz or above is considered to be flicker-free

Difference Between Raster Scan Display and Random Scan Display

By Dinesh Thakur

Raster Scan methods have increasingly become the dominant technology since about 1975. These methods use the TV type raster scan. The growth in the use of such methods has been dependent on rapidly decreasing memory prices and on the availability of cheap scan generating hardware from the TV industry.

 The screen is coated with discrete dots of phosphor, usually called pixels, laid out in a rectangular array. The image is then determined by how each pixel is intensified.  The representation of the image used in servicing the refresh system is thus an area of memory holding a value for each pixel. This memory area holding the image representation is called the frame buffer.

The values in the frame buffer are held as a sequence of horizontal lines of pixel values from the top of the screen down. The scan generator then moves the beam in a series of horizontal lines with fly-back (non-intensified) between each line and between the end of the frame and the beginning of the next frame. This is illustrated below.

Ranom Scan

Unlike random-scan which is a line drawing device, refresh CRT is a point-plotting device. Raster displays store the display primitives (lines, characters, shaded and patterned areas) in a refresh buffer. Refresh buffer (also called frame buffer) stores the drawing primitives in terms of points and pixels components This scan is synchronized with the access of the intensity values held in the frame buffer.

Raster Scan

The maximum number of points that can be displayed without overlap by a system is called the resolution and is quoted as the number of points per horizontal line versus the number of horizontal lines. Typical resolutions are 640*480, 1024*768, and 1280*1024. The maximum resolution is determined by the characteristics of the monitor and/or by the memory capacity available for storing the frame buffer.

Random Scan Display 

Random scan displays, often termed vector Vector, Stroke, and Line drawing displays, came first and are still used in some applications. Here the characters are also made of sequences of strokes (or short lines). The electron gun of a CRT illuminates straight lines in any order. The display processor repeatedly reads a variable ‘display file’ defining a sequence of X,Y coordinate pairs and brightness or color values, and converts these to voltages controlling the electron gun.

Random

In random scan display an electron beam is deflected from endpoint to end-point.


The order of deflection is dictated by the arbitrary order of the display commands. The display must be refreshed at regular intervals – minimum of 30 Hz (fps) for flicker-free display

Ideal Line Drawing

More Difference Between Vector Scan Display and Raster Scan Display

                       Vector Scan vs Raster Scan Display

Difference between Raster Scan System and Random Scan System

By Dinesh Thakur

Raster random


Magnet-Optical Storage Media

By Dinesh Thakur

There are used for erasable disks. MO system includes basic principles of both magnetic & optical storage systems. MO systems write magnetically & read optically. It has two standard forms : 5.25 inches & 3.5 inches.

Plasma displays, Thin film electro-luminescent display, Light-emitting diode ( LED ), Liquid Crystal Display (LCD)

By Dinesh Thakur

Plasma displays are bright, have a wide color gamut, and can be produced in fairly large sizes, up to 262 cm (103 inches) diagonally. They have a very low-luminance “dark-room” black level, creating a black some find more desirable for watching movies. The display panel is only about 6 cm (2½ inches) thick, while the total thickness, including electronics, is less than 10 cm (4 inches).

 Plasma displays use as much power per square meter as a CRT or an AMLCD television. Power consumption will vary greatly depending on what is watched on it. Bright scenes (say a football game) will draw significantly more power than darker scenes. The xenon and neon gas in a plasma television is contained in hundreds of thousands of tiny cells positioned between two plates of glass.

Long electrodes are also sandwiched between the glass plates, in front of and behind the cells. The address electrodes sit behind the cells, along the rear glass plate. The transparent display electrodes, which are surrounded by an insulating dielectric material and covered by a magnesium oxide protective layer, are mounted in front of the cell, along the front glass plate. Control circuitry charges the electrodes that cross paths at a cell, creating a voltage difference between front and back and causing the gas to ionize and form a plasma; as the gas ions rush to the electrodes and collide, photons are emitted.  

In a monochrome plasma panel, the ionizing state can be maintained by applying a lowlevel voltage between all the horizontal and vertical electrodes – even after the ionizing voltage is removed. To erase a cell all voltage is removed from a pair of electrodes. This type of panel has inherent memory and does not use phosphors. A small amount of nitrogen is added to the neon to increase hysteresis. In color panels, the back of each cell is coated with a phosphor.

The ultraviolet photons emitted by the plasma excite these phosphors to give off colored light. The operation of each cell is thus comparable to that of a fluorescent lamp. Every pixel is made up of three separate sub pixel cells, each with different colored phosphors. One sub pixel has a red light phosphor, one sub pixel has a green light phosphor and one sub pixel has a blue light phosphor. These colors blend together to create the overall color of the pixel, analogous to the “triad” of a shadowmask CRT.

Thin film electro-luminescent display

Electroluminescence is the result of radiative recombination of electrons and holes in a material (usually a semiconductor). The excited electrons release their energy as photons – light. Prior to recombination, electrons and holes are separated either as a result of doping of the material to form a p-n junction (in semiconductor electroluminescent devices such as LEDs), or through excitation by impact of high-energy electrons accelerated by a strong electric field (as with the phosphors in electroluminescent displays).

Powder phosphor-based electroluminescent panels are frequently used as backlights to liquid crystal displays. They readily provide a gentle, even illumination to the entire display while consuming relatively little electric power. They do, however, require relatively high voltage. Recently, blue, red and green emitting thin film electroluminescent materials have been developed that offer the potential for long life and full color electroluminescent displays. In either case, the EL material must be enclosed between two electrodes and at least one electrode must be transparent to allow the escape of the produced light.

Glass coated with indium oxide or tin oxide is commonly used as the front (transparent) electrode while the back electrode is or is coated with reflective metal. Additionally, other transparent conducting materials, such as carbon nanotubes coatings or PEDOT can be used as the front electrode. Unlike neon and fluorescent lamps, EL lamps are not negative resistance devices so no extra circuitry is needed to regulate the amount of current flowing through them. In principle, EL lamps can be made in any color. EL devices have low power consumption when compared with neon signs, and have a wide range of applications such as their use on advertising boards and safety signs.

Light-emitting diode ( LED )  

A light-emitting diode (LED) is a semiconductor diode that emits incoherent narrow-spectrum light when electrically biased in the forward direction of the p-n junction. This effect is a form of electroluminescence. An LED is usually a small area source, often with extra optics added to the chip that shapes its radiation pattern. The color of the emitted light depends on the composition and condition of the semi conducting material used, and can be infrared, visible, or near-ultraviolet. An LED can be used as a regular household light source.

Like a normal diode, an LED consists of a chip of semi conducting material impregnated, or doped, with impurities to create a p-njunction. As in other diodes, current flows easily from the p-side, or anode, to the n-side, or cathode, but not in the reverse direction. Charge-carriers—electrons and holes—flow into the junction from electrodes with different voltages. When an electron meets a hole, it falls into a lower energy level, and releases energy in the form of a photon. The wavelength of the light emitted, and therefore its color, depends on the band gap energy of the materials forming the p-n junction.

In silicon or germanium diodes, the electrons and holes recombine by a non-radiative transition which produces no optical emission, because these are indirect band gap materials. The materials used for an LED have a direct band gap with energies corresponding to near-infrared, visible or near-ultraviolet light. LEDs are usually built on an n-type substrate, with an electrode attached to the ptype layer deposited on its surface.

P-type substrates, while less common, occur as well. Many commercial LEDs, especially GaN/InGaN, also use sapphire substrate. Substrates that are transparent to the emitted wavelength, and backed by a reflective layer, increase the LED efficiency. The refractive index of the package material should match the index of the semiconductor, otherwise the produced light gets partially reflected back into the semiconductor, where it may be absorbed and turned into additional heat, thus lowering the efficiency. An anti-reflection coating may be added as well.

Liquid Crystal Display (LCD)  

An active matrix liquid crystal display (AMLCD) is a type of flat panel display, currently the overwhelming choice of notebook computer manufacturers, due to light weight, very good image quality, wide color gamut, and response time. The most common example of an active matrix display contains, besides the polarizing sheets and cells of liquid crystal, a matrix of thin-film transistors (TFTs) to make a TFT LCD.

Each pixel of an LCD typically consists of a layer of molecules aligned between two transparent electrodes, and two polarizing filters, the axes of transmission of which are (in most of the cases) perpendicular to each other. With no liquid crystal between the polarizing filters, light passing through the first filter would be blocked by the second (crossed) polarizer. The surface of the electrodes that are in contact with the liquid crystal material are treated so as to align the liquid crystal molecules in a particular direction. This treatment typically consists of a thin polymer layer that is unidirectionally rubbed using, for example, a cloth.

The direction of the liquid crystal alignment is then defined by the direction of rubbing. When a voltage is applied across the electrodes, a torque acts to align the liquid crystal molecules parallel to the electric field, distorting the helical. This reduces the rotation of the polarization of the incident light, and the device appears gray. If the applied voltage is large enough, the liquid crystal molecules in the center of the layer are almost completely untwisted and the polarization of the incident light is not rotated as it passes through the liquid crystal layer. This light will then be mainly polarized perpendicular to the second filter, and thus be blocked and the pixel will appear black.

By controlling the voltage applied across the liquid crystal layer in each pixel, light can be allowed to pass through in varying amounts thus constituting different levels of gray.Both the liquid crystal material and the alignment layer material contain ionic compounds. If an electric field of one particular polarity is applied for a long period of time, this ionic material is attracted to the surfaces and degrades the device performance.

This is avoided either by applying an alternating current or by reversing the polarity of the electric field as the device is addressed. When a large number of pixels is required in a display, it is not feasible to drive each directly since then each pixel would require independent electrodes. Instead, the display is multiplexed. In a multiplexed display, electrodes on one side of the display are grouped and wired together (typically in columns), and each group gets its own voltage source. On the other side, the electrodes are also grouped (typically in rows), with each group getting a voltage sink.

Shadow Mask CRT (Cathode Ray Tube)

By Dinesh Thakur

In Shadow Mask CRT tiny holes in a metal plate separate the colored phosphors in the layer behind the front glass of the screen. The holes are placed in a manner ensuring that electrons from each of the tube’s three cathode guns reach only the appropriately-colored phosphors on the display. All three beams pass through the same holes in the mask, but the angle of approach is different for each gun.

 The spacing of the holes, the spacing of the phosphors, and the placement of the guns is arranged so that for example the blue gun only has an unobstructed path to blue phosphors. The red, green, and blue phosphors for each pixel are generally arranged in a triangular shape (sometimes called a “triad”). All early color televisions and the majority of computer monitors, past and present, use shadow mask technology.


Traditionally, shadow masks have been made of materials which temperature variations cause to expand and contract to the point of affecting performance. The energy the shadow mask absorbs from the electron gun in normal operation causes it to heat up and expand, which leads to blurred or discolored (see doming) images. The invar shadow mask is composed of the nickel-iron alloy invar.


Therefore it expands and contracts much less than other materials in response to temperature changes. This property allows displays made with this technology to provide a clearer, more accurate picture. It also reduces the amount of long-term stress and damage to the shadow mask that can result from repeated expand/contract cycles, thus increasing the display’s life expectancy.


In other words, In Shadow Mask CRT, before the stream of electrons produced by the CRT’s cathode reach the phosphor coated faceplate, it encounters the shadow mask, a sheet of metal etched with a pattern of holes. The mask is positioned in the glass funnel of the CRT during manufacture and the phosphor is coated onto the screen so that electrons coming from the red, green and blue gun positions only land on the appropriate phosphor.

                                                                              RGB Triad

Stray electrons strike the shadow mask and are absorbed by it, generating a great deal of heat, which in turn causes the metal to expand. To allow flatter CRTs to be made, the metal most commonly used now for shadow masks is Invar, an alloy of iron and nickel. The metal has a low coefficient of expansion and its name derives from the supposed invariability of its dimensions when heat is applied. In reality, its dimensions are not completely invariable and the build up of heat in a shadow mask can lead to a form of distortion known as doming, where the centre of the mask bulges towards the faceplate slightly.


                                                     Shadow Mask

An alternative to the shadow mask which is less prone to distortion, the aperture grille , was included as part of the design of Trinitron CRTs by Sony in 1968 and Mitsubishi in its Diamondtron products in the early 1990s.


What is Color CRT Display? Explain Beam-penetration and Shadow-mask method

By Dinesh Thakur

This was one the earlier CRTs to produce color displays. Coating phosphors of different compounds can produce different colored pictures. But the basic problem of graphics is not to produce a picture of a predetermined color, but to produce color pictures, with the color characteristics chosen at run time.

The basic principle behind colored displays is that combining the 3 basic colors –Red, Blue and Green, can produce every color. By choosing different ratios of these three colors we can produce different colors – millions of them in-fact. We also have basic phosphors, which can produce these basic colors. So, one should have a technology to combine them in different combinations.

 There are two popular techniques for producing color displays with a CRT are:

Beam Penetration method 

This CRT is similar to the simple CRT, but it makes use of multi coloured phosphorus of number of layers. Each phosphorus layer is responsible for one colour. All other arrangements are similar to simple CRT. It can produce a maximum of 4 to 5 colours 

The organization is something like this – The red, green and blue phosphorus are coated in layers – one behind the other. If a low speed beam strikes the CRT, only the red colored phosphorus is activated, a slightly accelerated beam would activate both red and green (because it can penetrate deeper) and a much more activated one would add the blue component also.

But the basic problem is a reliable technology to accelerate the electronic beam to precise levels to get the exact colors – it is easier said than done. However, a limited range of colors can be conveniently produced using the concept.

The Shadow – Mask method.

         shadowmask-beams

  This works, again, on the principle of combining the basic colors – Red, green and Blue – in suitable proportions to get a combination of colors, but it’s principle is much more sophisticated and stable.

The shadow mask CRT, instead of using one electron gun, uses 3 different guns placed one by the side of the other to form a triangle or a “Delta” as shown. Each pixel point on the screen is also made up of 3 types of phosphors to produce red, blue and green colors. Just before the phosphor screen is a metal screen, called a “shadow mask”. 

This plate has holes placed strategically, so that when the beams from the three electron guns are focused on a particular pixel, they get focused on particular color producing pixel only i.e. If for convenience sake we can call the electronic beams as red, blue and green beams (though in practice the colors are produced by the phosphors, and until the beams hit the phosphor dots, they produce no colors), the metal holes focus the red beam onto the red color producing phosphor, blue beam on the blue producing one etc. When focused on to a different pixel, the red beam again focuses on to the red phosphor and so on.

Now, unlike the beam penetration CRTs where the acceleration of the electron beam was being monitored, we now manipulate the intensity of the 3 beams simultaneously. If the red beam is made more intense, we get more of red color in the final combination etc. Since fine-tuning of the beam intensities is comparatively simple, we can get much more combination of colors than the beam penetration case. In fact, one can have a matrix of combinations to produce a wide variety of colors.

The shadow mask CRT, though better than the beam penetration CRT in performance, is not without it’s disadvantages. Since three beams are to be focused, the role of the “Shadow mask” becomes critical. If the focusing is not achieved properly, the results tend to be poor. Also, since instead of one pixel point in a monochrome CRT now each pixel is made up of 3 points (for 3 colors), the resolution of the CRT (no. of pixels) for a given screen size reduces. 

Another problem is that since the shadow mask blocks a portion of the beams (while focusing them through the holes) their intensities get reduced, thus reducing the overall brightness of the picture. To overcome this effect, the beams will have to be produced at very high intensities to begin with. Also, since the 3 color points, though close to each other, are still not at the same point, the pictures tend to look like 3 colored pictures placed close by, rather than a single picture. Of course, this effect can be reduced by placing the dots as close to one another as possible.

The above displays are called refresh line drawing displays, because the picture vanishes (typically in about 100 Milli seconds ) and the pictures have to be continuously refreshed so that the human persistence of vision makes them see as static pictures. They are costly on one hand and also tend to flicker when complex pictures are displayed (Because refreshing because complex).

These problems are partly overcome by devices with inherent storage devices – i.e. they continue to display the pictures, till they are changed or at least for several minutes without the need of being refreshed. We see one such device called the Direct View Storage Tube (DVST) below.


DVST – Direct View Storage Tube

By Dinesh Thakur

Conceptually the Direct View Storage Tube (DVST) behaves like a CRT with highly persistent phosphor. Pictures drawn on there will be seen for several minutes (40-50 minutes) before fading. It is similar to CRT as far as the electronic gun and phosphor-coated mechanisms are concerned. But instead of the electron beam directly writing the pictures on the phosphor coated CRT screen, the writing is done with the help of a fine-mesh wire grid.

The grid made of very thin, high quality wire, is located with a dielectric and is mounted just before the screen on the path of the electron beam from the gun. A pattern of positive charges is deposited on the grid and this pattern is transferred to the phosphor coated CRT by a continuous flood of electrons. This flood of electrons is produced by a “flood gun” (This is separate frame the electron gun that produces the main electron beam).

Just behind the storage mesh is a second grid called the collector. The function of the collector is to smooth out the flow of flood electrons. Since a large number of electrons are produced at high velocity by the flood gun, the collector grid, which is also negatively charged reduces, the acceleration on these electrons and the resulting low velocity flood pass through the collector and get attracted by the positively charged portions of the storage mesh (Since the electrons are negatively charged), but are repelled by the other portions of the mesh which are negatively charged (Note that the pattern of positive charges residing on the storage mesh actually defines the picture to be displayed).

  DVST

Thus, the electrons attracted by the positive charges pass through the mesh, travel on to the phosphor coated screen and display the picture. Since the collector has slowed the electrons down, they may not be able to produce sharp and bright images. To over come this problem, the screen itself is maintained at a high positive potential by means of a voltage applied to a thin aluminum coating between the tube face and the phosphor.

The dotted circle on the mesh is created by positive charges the flood of electrons hit the mesh at all points. But only those electrons that hit the dotted circle pass through and hit the CRT screen. The negatively charged mesh repels others.

 Since the phosphor is of a very high persistence quality, the picture created on the CRT screen will be visible for several minutes without the need for being refreshed.

 Now the problem arises as to how do we remove the picture, when the time for it’s erasure or modification comes up. The simple method is to apply a positive charge to the negatively charged mesh so that it gets neutralized. This removes all charges and clears the screen. But this technique also produces a momentary flash, which may be unpleasant to the viewer.

This is mainly so when only portions of the picture are to be modified in an interactive manner. Also, since the electrons hit the CRT screen at very low speeds (though they are slightly accelerated in the last part of their journey to the CRT by a positively charged aluminum coating), the contrasts are not sharp. Also, even though the pictures stay for almost an hour, there will be a  gradual degradation because of the accumulation of the background glow.

The  other popular display device is the plasma panel device, which is partly similar to the DVST in principle, but over comes some of the undesirable features of the DVST.


How the interactive graphics displayed works? Explain

By Dinesh Thakur

All operations on computers are in terms of 0’s and 1’s and hence figures are also to be stored in terms of 0’s and 1’s. Thus a picture file, when viewed inside the memory, can be no different from other files – a string of Os and 1s. However, their treatment when they are to be displayed makes the difference. Pictures are actually formed with the help of frame-buffer display as follows


 Frame buffer display contains a frame buffer, which is a storage device and stores the image in terms of 0’s and 1’s. It contains the 0’s and 1’s in terms of 8’s, or multiples of 8’s in a row. These 0’s and 1’s will be read by display controller one line at a time and sent to the screen after converting them from digital to analog. The display controller reads the contents of frame buffer one line at a time or entire digits at time. These digital images after converting into the analog will be displayed on the screen. The following figure illustrates this             graphics display system

Figures can be stored and drawn in two ways – either by line drawing or by Raster graphic methods. In the line drawing scheme, the figures are represented by equations – for example a straight line can be represented by the equation y=mx+c, a circle by x2+y2=r2 etc. If (x, y) are representative points, then all these (x,y) value pairs which satisfy the equations form a part of the figure while those that do not, lie outside the figure. Thus, to generate any figure, obviously the equation of the figure is to be known. Then all points that satisfy the equation are evaluated. These are the points to be illuminated on the screen.                                  points to be illuminated


A moving electronic beam, as we know illuminates the screen, or the monitor. Whenever the beam is switched on, the electrons illuminate the phosphorescent screen and display a point. In the line drawing schemes, this beam is made to traverse the path of the figure to be traced and we get the figure we need. For example, in the above cited example if the electron beam is made to move from a to be along the points, we get the line.


The raster scan mechanism uses a different technique and is often found more convenient to manipulate and operate with. In this case, a “frame buffer”, (a chunk of memory) is made to store the pixel values. (Remember, the screen can be thought of as having beam made up of a number of horizontal rows of pixels (picture cells), each pixel representing a point on the picture. In fact the number of such horizontal and vertical points indicate higher resolutions and therefore better pictures.


Typical resolutions are like 640 X 480, 860 X 640, 1024 x 860 etc., where the figures indicate the number of rows and the number of pixels along each row respectively on a computer screen (unlike in standard mathematics) the top left hand point indicates the origin or the point (0,0) and the distances are measured horizontally and vertically as shown).

            Hori verticlal

Now, assuming a 1024 x 1024 point screen, any figure that is to be displayed within this space. The “frame buffer” stores “status” of each of these pixels – say 0 indicates the pixel is off and hence is not a part of the picture and 1 indicates it is a part of the picture, and is to be displayed. This data is used to display the pictures.

Working of an Interactive Graphics Display

By Dinesh Thakur

Interactive graphics display consists of three components [Read more…] about Working of an Interactive Graphics Display

What are the Difficulties for Displaying Pictures

By Dinesh Thakur

Unfortunately, the concept of graphics of displaying pictures is lot more complicated than what has been described so far – evaluate the points using the equations, store them in a file and use raster graphics methods or use simple line drawing algorithms.

 i) Stair case effects: Note that the pixel values are always integers (0,0) (0,1) (0,2) – – – – – — – -, but an algorithm to draw/manipulate pictures need not always return integer values. Suppose the point at which two line meet, say is at (1.4, 2.7). What do we do? Common sense suggests that we round off the values, by using any of the standard algorithms.


Excellent. 1.4 gets rounded of to 1 and 2.7 to 3. But another value of 1.6 say gets rounded off to 2 and a value of 3.1 also gets rounded of to 3. So, what do we have? The pointer 1.4 and 1.6, which should be very close to each other, appear to be separated by a distance of 1 and not 0.2 in our figure, i.e. the smoothness of a figure joining these points is lost. Alternately, the points 2.7 and 3.1, instead of appearing to be different, appear to be the same in our picture. A no. of such adjustments makes the figure looks like a jagged one instead of a smooth fig.                                                             stair case effect

ii) Response time: Especially when talking of animation, the speed at which new calculations are made and the speed at which the screen can interact are extremely important. Imagine a running bus, shown on the screen. Each new position of the bus (and it’s surroundings, if needed) is to be calculated and sent to the screen and the screen should delete the earlier position of the bus and display its new position.


All this should happen at a speed that convinces the viewer that the vehicle is actually moving at the prescribed speed, otherwise a running vehicle would appear like a “walking” bus or worse a “piecewise movement” bus. For this, most the speed of the algorithm and the speed of the display devices are extremely important. Further, the entire operation should appear smooth and not jerky otherwise, especially in simulation applications, the effects can be dangers.


iii) What happens when the size of the picture exceeds the size of the screen?:

Obviously, some areas of the picture are to be cut off. But this involves certain considerations and needs to be addressed by software. [Which we will discuss while discussing about clipping and windowing


iv) Can the user create pictures directly on the screen? Definitely all pictures can not be thought of in terms of regular geometric figures and hence in terms of equations? Now, seeing a particular picture on the screen, the viewer wants to change it slightly, say bend it slightly here, stretch it their etc. This may not suit any regular equation? How should the system handle it?

Applications of Computer Graphics

By Dinesh Thakur

The following are also considered graphics applications

Paint programs: Allow you to create rough freehand drawings. The images are stored as bit maps and can easily be edited. It is a graphics program that enables you to draw pictures on the display screen which is represented as bit maps (bit-mapped graphics). In contrast, draw programs use vector graphics (object-oriented images), which scale better.

Most paint programs provide the tools shown below in the form of icons. By selecting an icon, you can perform functions associated with the tool.In addition to these tools, paint programs also provide easy ways to draw common shapes such as straight lines, rectangles, circles, and ovals.

Sophisticated paint applications are often called image editing programs. These applications support many of the features of draw programs, such as the ability to work with objects. Each object, however, is represented as a bit map rather than as a vector image.

Illustration/design programs: Supports more advanced features than paint programs, particularly for drawing curved lines. The images are usually stored in vector-based formats. Illustration/design programs are often called draw programs. Presentation graphics software: Lets you create bar charts, pie charts, graphics, and other types of images for slide shows and reports. The charts can be based on data imported from spreadsheet applications. 

A type of business software that enables users to create highly stylized images for slide shows and reports. The software includes functions for creating various types of charts and graphs and for inserting text in a variety of fonts. Most systems enable you to import data from a spreadsheet application to create the charts and graphs. Presentation graphics is often called business graphics.
Animation software: Enables you to chain and sequence a series of images to simulate movement. Each image is like a frame in a movie. It can be defined as a simulation of movement created by displaying a series of pictures, or frames. A cartoon on television is one example of animation. Animation on computers is one of the chief ingredients of multimedia presentations. There are many software applications that enable you to create animations that you can display on a computer monitor.

There is a difference between animation and video. Whereas video takes continuous motion and breaks it up into discrete frames, animation starts with independent pictures and puts them together to form the illusion of continuous motion.

CAD software: Enables architects and engineers to draft designs. It is the acronym for computer-aided design. A CAD system is a combination of hardware and software that enables engineers and architects to design everything from furniture to airplanes. In addition to the software, CAD systems require a high-quality graphics monitor; a mouse, light pen, or digitizing tablet for drawing; and a special printer or plotter for printing design specifications.

CAD systems allow an engineer to view a design from any angle with the push of a button and to zoom in or out for close-ups and long-distance views. In addition, the computer keeps track of design dependencies so that when the engineer changes one value, all other values that depend on it are automatically changed accordingly. Until the mid 1980s, all CAD systems were specially constructed computers. Now, you can buy CAD software that runs on general-purpose workstations and personal computers. 

Desktop publishing: Provides a full set of word-processing features as well as fine control over placement of text and graphics, so that you can create newsletters, advertisements, books, and other types of documents. It means by using a personal computer or workstation high-quality printed documents can be produced. A desktop publishing system allows you to use different typefaces, specify various margins and justifications, and embed illustrations and graphs directly into the text. The most powerful desktop publishing systems enable you to create illustrations; while less powerful systems let you insert illustrations created by other programs.

As word-processing programs become more and more powerful, the line separating such programs from desktop publishing systems is becoming blurred. In general, though, desktop publishing applications give you more control over typographical characteristics, such as kerning, and provide more support for full-color output.

A particularly important feature of desktop publishing systems is that they enable you to see on the display screen exactly how the document will appear when printed. Systems that support this feature are called WYSIWYGs (what you see is what you get). Until recently, hardware costs made desktop publishing systems impractical for most uses. But as the prices of personal computers and printers have fallen, desktop publishing systems have become increasingly popular for producing newsletters, brochures, books, and other documents that formerly required a typesetter. 

Once you have produced a document with a desktop publishing system, you can output it directly to a printer or you can produce a PostScript file which you can then take to a service bureau. The service bureau has special machines that convert the PostScript file to film, which can then be used to make plates for offset printing. Offset printing produces higher-quality documents, especially if color is used, but is generally more expensive than laser printing.

In general, applications that support graphics require a powerful CPU and a large amount of memory. Many graphics applications—for example, computer animation systems—require more computing power than is available on personal computers and will run only on powerful workstations or specially designed graphics computers. This is true of all three-dimensional computer graphics applications.

In addition to the CPU and memory, graphics software requires a graphics monitor and support for one of the many graphics standards. Most PC programs, for instance, require VGA graphics. If your computer does not have built-in support for a specific graphics system, you can insert a video adapter card.

The quality of most graphics devices is determined by their resolution—how many pixels per square inch they can represent—and their color capabilities.

Cathode Ray Tube

By Dinesh Thakur

The primary output device in a graphics system is a video monitor. The operation of most video monitors is based on the standard cathode ray tube (CRT) design. [Read more…] about Cathode Ray Tube

What is Frame Buffer

By Dinesh Thakur

A frame buffer is a large, contiguous piece of computer memory. At a minimum  there is one memory bit for each pixel in the rater; this amount of memory is called a bit  plane. The picture is built up in the frame buffer one bit at a time. [Read more…] about What is Frame Buffer

What is Image Resolution

By Dinesh Thakur

Image resolution describes the detail an image holds. The term applies equally to digital images, film images, and other types of images. Higher resolution means more image detail. Image resolution can be measured in various ways. Basically, resolution quantifies how close lines can be to each other and still be visibly resolved.


Resolution units can be tied to physical sizes (e.g. lines per mm, lines per inch) or to the overall size of  a  picture (lines  per  picture  height,  also  known  simply  as  lines,  or  TV  lines). Furthermore, line pairs are often used instead of lines. A line pair is a pair of adjacent dark and light lines, while a line counts both dark lines and light lines. A resolution of 10 lines per mm means 5 dark lines alternating with 5 light lines, or 5 line pairs per mm. Photographic lens and film resolution are most often quoted in line pairs per mm.


Image resolution on raster displays


A television or raster image display with 525 scan lines makes a picture with somewhat less than 525 TV lines of resolution. The ratio of lines of resolution to the number of format lines in known as the Kell factor,   after Raymond D. Kell, who worked out details of visual resolution in scanned systems at RCA in the 1930s.

What is a pixel in Computer Graphics

By Dinesh Thakur

A pixel (short for picture element, using the common abbreviation “pix” for “picture”) is one of the many tiny dots that make up the representation of a picture in a computer’s memory. Each such information element is not really a dot, nor a square, but an abstract sample. [Read more…] about What is a pixel in Computer Graphics

« Previous Page
Next Page »

Primary Sidebar

Computer Graphics Tutorials

Computer Graphics

  • CG - Home
  • CG - Introduction
  • CG - Applications
  • CG - Applications
  • CG - Raster Vs Random Scan Display
  • CG - Frame Buffer
  • CG - DVST
  • CG - CRT Display
  • CG - DDA
  • CG - Transformation
  • CG - Cathode Ray Tube
  • CG - Bresenham’s Line Algorithm
  • CG - Pixel
  • CG - Data Compression
  • CG - Clipping
  • CG - Shadow Mask CRT
  • CG - Line Drawing Algorithm
  • CG - Text Clipping
  • CG - Refresh Rates
  • CG - CRT/Monitor
  • CG - Interactive Graphics Display
  • CG - Raster Vs Random Scan System
  • CG - Liquid Crystal Display
  • CG - Scan Converting a Line
  • CG - Monitors Types
  • CG - Display Types
  • CG - Sutherland-Hodgeman Clipping
  • CG - Bitmap
  • CG - Antialiasing
  • CG - Refresh Rates
  • CG - Shadow Mask Vs Beam Penetration
  • CG - Scan Converting a Point
  • CG - Image Resolution
  • CG - Double Buffering
  • CG - Raster Vs Random Scan
  • CG - Aspect Ratio
  • CG - Ambient Light
  • CG - Image Processing
  • CG - Interactive Graphics Displayed
  • CG - Shadow Mask CRT
  • CG - Dithering
  • CG - GUI
  • CG - CLUT
  • CG - Graphics
  • CG - Resolutions Types
  • CG - Transformations Types
  • CG - Half-toning Effect
  • CG - VGA
  • CG - Aliasing
  • CG - CGA

Other Links

  • Computer Graphics - PDF Version

Footer

Basic Course

  • Computer Fundamental
  • Computer Networking
  • Operating System
  • Database System
  • Computer Graphics
  • Management System
  • Software Engineering
  • Digital Electronics
  • Electronic Commerce
  • Compiler Design
  • Troubleshooting

Programming

  • Java Programming
  • Structured Query (SQL)
  • C Programming
  • C++ Programming
  • Visual Basic
  • Data Structures
  • Struts 2
  • Java Servlet
  • C# Programming
  • Basic Terms
  • Interviews

World Wide Web

  • Internet
  • Java Script
  • HTML Language
  • Cascading Style Sheet
  • Java Server Pages
  • Wordpress
  • PHP
  • Python Tutorial
  • AngularJS
  • Troubleshooting

 About Us |  Contact Us |  FAQ

Dinesh Thakur is a Technology Columinist and founder of Computer Notes.

Copyright © 2025. All Rights Reserved.

APPLY FOR ONLINE JOB IN BIGGEST CRYPTO COMPANIES
APPLY NOW