The status bar is located at the bottom of the working window of Excel 2010, and at first glance, it may seem that it is mainly a decorative element. However, in Excel, the status bar is an efficient and highly functional interface element, skillful use of which significantly improves productivity and facilitates data processing. In Figure below shows what a standard Excel status bar might look like below.
![]()
The icons and controls on the right side of the status bar have already been described earlier (except, perhaps, the icon for switching to the pagination line display mode, but this will be done later). On the left side of the status bar, there is an indicator in which, if the document is ready for work (entering and editing data by the user), the message “Ready” is displayed. It is followed by an icon for switching to the macro recording mode. This element is described in the VBA Programming Part V. By and large, if an empty cell is selected in a working document, this will exhaust the elements, indicators, and icons displayed by default in the status bar. However, you can expand the functionality of the status bar using special settings.
To customize the status bar, right-click on it, as a result of which the Customize status bar list opens.
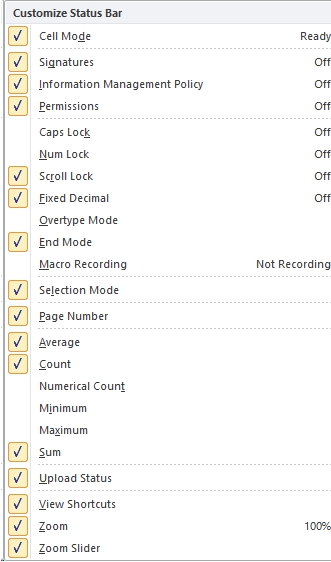
The list contains many items. By checking or unchecking the checkboxes, you can add or remove indicators and icons in the status bar. For some list items corresponding to the mode indicators, the current state (value) is displayed on the right side. In particular, for a message to appear in the status bar when you switch to the mode of entering uppercase letters, check the box next to the Caps Lock position. In this case, the status bar will look as shown in the figure below.
![]()
The aforementioned macro recording icon is displayed in the status line if the Macro recording checkbox is checked. As noted above, the group of view switching icons corresponds to the View mode shortcuts position, and the Scale and Scale slider positions are designed to display the thumbnail and a bar (with a slider) for selecting a scale.
The third section from the bottom in the Status bar settings list is quite interesting. In particular, if you check the boxes next to Average (calculating the Average), Count (number of non-empty cells), Minimum (minimum value), and Sum (Sum of cell values) and then in the working document.
Four additional messages will appear in the status bar if you want to select a range of non-empty cells.
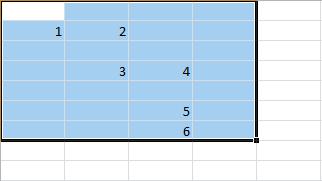
For the selected range of cells, the average value, the number of nonblank cells, the minimum value and the sum of the values in the cells are automatically calculated
More specifically: the Number of nonblank cells is determined in the selected range of cells, and the average value and the total sum of values in nonblank cells are calculated from these cells.
The Number of calculated parameters can be increased by checking the boxes next to the Number of numbers (the Number of non-empty cells with numeric values) and Maximum (maximum of values) positions in the status bar settings list. The result of applying such settings is illustrated in the figure below.
One of the cells contains a text value, so the total Number of nonblank cells is one less than the Number of nonblank cells with numeric values. When calculating the average and sum of values in cells, cells with text values are ignored.
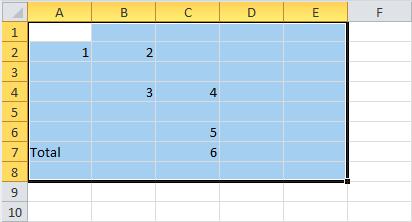
For the selected range of cells, the average value is automatically calculated,
number of nonblank cells, number of nonblank cells with numeric values, minimum number, maximum number, and sum of values in cells.
 Dinesh Thakur holds an B.C.A, MCDBA, MCSD certifications. Dinesh authors the hugely popular